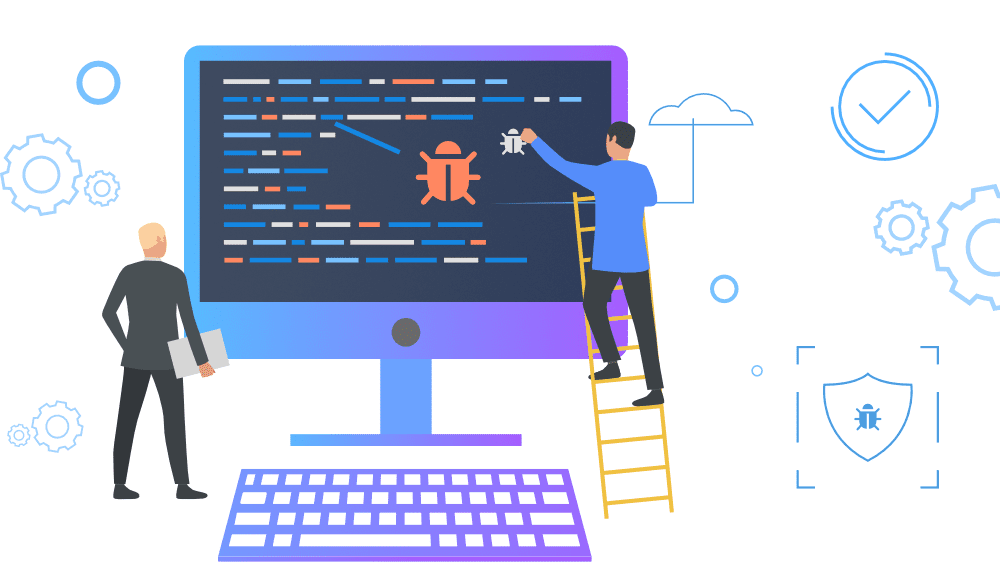
Debugging is crucial in programming to find and fix coding errors. For effective debugging, adopt a systematic approach: reproduce the problem, isolate the source of the bug, understand it, fix it, and retest. Tools like Integrated Development Environments (IDEs), print statements, and code linters can assist in the process. Additionally, each debugging session provides valuable learning experiences to improve future coding. While debugging may seem daunting, it becomes manageable with the right strategies and can improve your efficiency and productivity as a programmer. See bugs as learning opportunities, making you a more accomplished coder.
Debugging Made Easy: Tips and Techniques for Solving Programming Errors
Debugging is an essential skill for any programmer. It refers to the process of identifying, isolating, and fixing problems or ‘bugs’ in computer code. Despite its importance, debugging often seems formidable to beginners. However, with the right techniques and strategies, it ceases to be a dreadful task and can become a straightforward process. This article will provide useful tips and proven techniques to make debugging less overwhelming and improve your code fixing efficiency.
Understanding The Importance of Debugging
Before we dive into the debugging techniques, it is vital to understand its importance. Writing a code, no matter how much experience a programmer has, will inevitably come with unforeseen errors. Such errors could break the code from functioning correctly, lead to incorrect results, or make the application prone to security vulnerabilities. That’s where debugging steps in and helps identify and rectify these issues, ensuring the code performs the desired operations correctly and efficiently.
Adopt a Systematic Approach
When it comes to debugging, the first tip is to approach it systematically rather than randomly. Initially, reproduce the problem. Then, isolate the source of the bug and understand why it’s happening. Once diagnosed, you can then come up with a solution and finally retest the application. This systematic approach saves a lot of time and will more likely lead you to the root cause of the error.
Reproduce The Problem
Reproducing the problem means making the bug appear consistently at your will. It includes understanding the conditions under which the bug surfaces. It could be a click of a specific button, a form submission with particular inputs, or a response to a certain API call. Reproducing the error gives you better control and helps you test whether the issue is resolved after the debugging process.
Isolate the Source
Once the problem is reproduced reliably, the next step is to isolate the source of the bug. It involves identifying the piece of code causing the problem. You can track this by examining the stack trace of the error message if available, adding log statements, or utilizing debugging tools such as breakpoints in your code.
Understand The Bug
Identifying the problematic part of the code is essential, but it is of equal importance to comprehend why that part of the code behaves as it does. Understanding the bug is done by reviewing the code in question, considering it in light of how your application should work, and figuring out why it’s not behaving as expected. This understanding goes a long way in ensuring that your bug fix is correct.
Fix The Bug and Retest
After understanding the bug, you can now proceed to fix it. This could be as simple as fixing a typo, removing an off-by-one error, or as complex as redesigning a part of your algorithm. Before moving on, make sure that the bug fix works as intended and does not introduce new problems. You can confirm this by retesting the application to ensure the bug does not reoccur.
Debugging Tools and Techniques
Besides the systematic approach, several tools and techniques can aid you in the debugging process. These may include:
Integrated Development Environment (IDE)
Maintaining a clean and organized code can be a lifesaver during debugging. Integrated Development Environments (IDEs) can help with its auto-indentation, syntax highlighting, and bracket matching features. Most IDEs also come with integrated debuggers that step through the code line by line, allowing you to examine variable values, and evaluate expressions at any point during the program’s execution.
Print Statements
Print statements are one of the most rudimentary yet effective debugging techniques. Strategically placed print statements in the code can give a sense of the program’s flow and track variables at different execution points.
Code Linters
Code Linters are tools that analyze code for potential errors and stylistic issues. These can help you spot syntactical mistakes, non-standard coding practices, and even some logical errors that might lead to unexpected behavior.
Learn from Each Debugging Session
Every error you encounter and every bug you fix is an opportunity to learn and prevent similar mistakes from happening again. This learning process makes you better conditioned to spot and fix bugs quickly in the future. Therefore, debugging is much more about creating a mindset where you sneakily outdo your past self.
Conclusion
Debugging, while often portrayed as a daunting task, can be made considerably more manageable with the right strategies. Undertaking a systematic approach, utilizing handy tools, and most importantly, viewing each bug as a learning opportunity, enhances coding efficiency, and productiveness. See bugs as challenges instead of problems, each one conquered making you a more skilled programmer!
